¶ Common features
SnapPlus V3 has many features that occur in more than one place in the application. This page covers some of those features and how to use them.
¶ Data tables
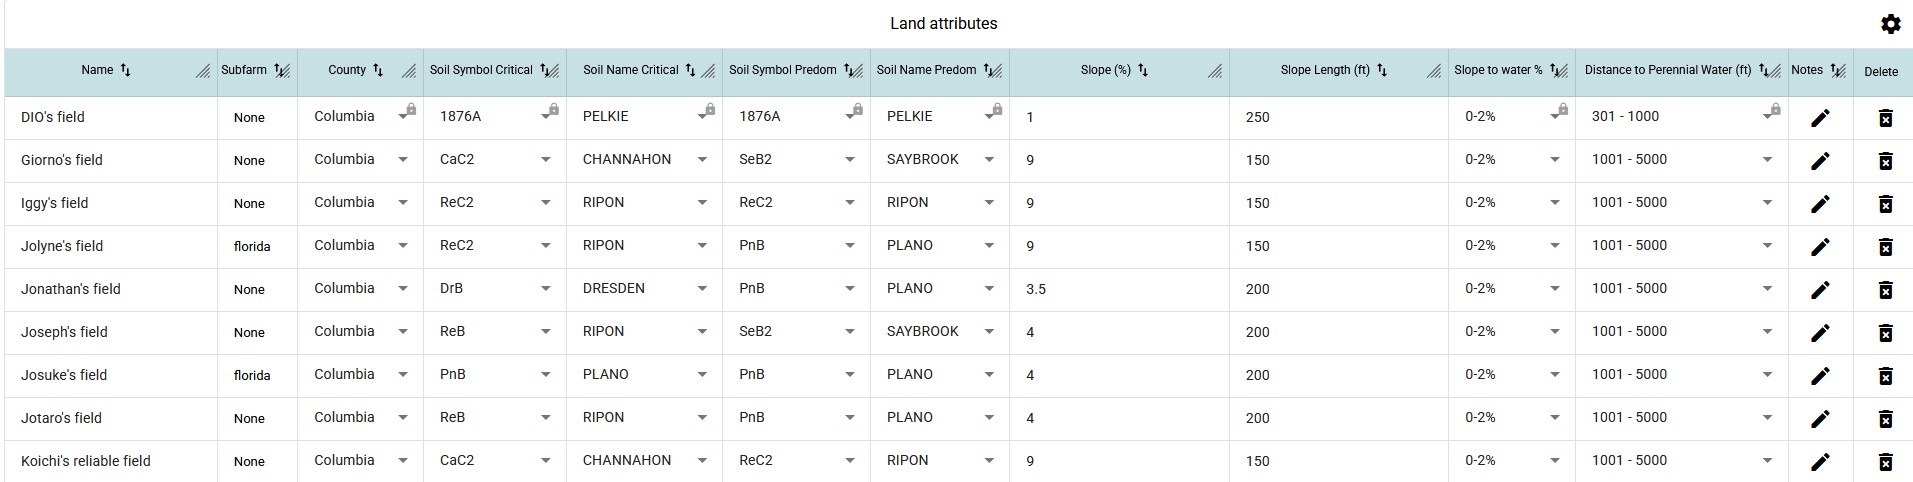
Data tables are found on many pages in SnapPlus 3. The below example is from the land attributes tab on the fields page:
¶ Saving and validating data
Data will be saved automatically if it is correctly entered. If data in a cell is not valid, an error message will display in red. In the example below, a new row has been added to the table for land attributes, but the field has not been given a name. There is a message indicating that the name is required:

SnapPlus will not save any changes made to the data in a row in the table if there are errors in any of the cells in the row.
¶ Sorting, filtering and displaying data
Let's break down the important parts:
- Title: data tables usually have descriptive titles at the top.
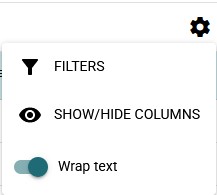
- Settings: the gear icon in the top right corner offers different settings, depending on the specific table:
- Filters: Filters can be added to group data based on shared properties. There are a few kinds of filtering available, depending on the form of the data being filtered. For example:

Here we see have selected filters for field name, county and slope %. We can type any text in the filter box for field name, and SnapPlus will filter the table data down to values of that property that include the filter text. A field's county is one of a handful of options, so that filter will be in the form of a dropdown, from which we can select a county out of all of the counties that are set on some field in the table. Slope % is a number, so we can set minimum and maximum values in the greater than and less than boxes.
Additional filters may be used depending on the data. On the fields page, data can be filtered by field group and subfarm. These kinds of filters will be applied automatically as needed.
¶ Additional features
There are some other configuration options for SnapPlus V3 data tables:
- Show/hide columns: depending on the data you want displayed, columns can be selected from a list to show or hide.
- Wrap text: Controls the display of text in the cells in the table.
- Sorting: in most cases, data can be sorted on the value in any column by clicking the little arrow icon in the column header. This will alternate between ascending and descending sort orders on a given column's values.
- Resize: the icon in the corner of each column header represents width resizing. Clicking and dragging the icon will adjust column widths as desired.
¶ Selecting row(s) of data
Clicking on a row in the data table will highlight it light blue. A row of data must be highlighted/selected in order to change its data. In the above example, selecting a row will enable the text input boxes and dropdown menus necessary for data entry.
In many cases, the data in the selected/highlighted row will control the other data that is visible on the page. It may also influence the data that displays on other tabs and pages in the application. Some examples of this behavior include:
- On the soil tests tab, the soil sample data in the data table on the bottom part of the page will be specific to the selected soil test data.
- On all tabs of the management page, the highlighted crop will determine which nutrient applications are displayed in the Nutrient Application Planner. The selected row will also determine the behavior of certain buttons in the field view and template builder tabs.
- The field that is highlighted in the land attributes data table (pictured above) will control what soil test data is displayed by default on the soil test tab, as well as what field's crops display in the field view tab.
- The selected nutrient source on the manure/biosolids tab will determine what manure analysis data appears in the bottom data table.
¶ Editing data in the selected row
SnapPlus will automatically save data upon entry, as indicated by the blue progress bar at the bottom of the screen. Data will not be saved if there are error messages visible in the table cells.
¶ Locked data
Sometimes, a lock icon will display in the corner of the cell. In the example above, cells are locked to indicate the data in them can't be overwritten by map data. In that case, data can be modified from within the table. The template builder will also lock some cells, but that data may not be modified.
¶ Update multiple rows
Some data tables will have a feature that allows for setting values on more than one row at the same time:
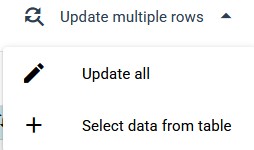
This can be convenient when updating information that is shared across fields, or resetting data on multiple crops quickly if something happened in the planning period. Multiple rows of data can be updated at once by:
- Update all: This will update any data that is displayed currently in the table. You can combine this with filtering table data to get subsets of data that should be modified as a group.
- Select data from table: Pick and choose the data you'd like to update.
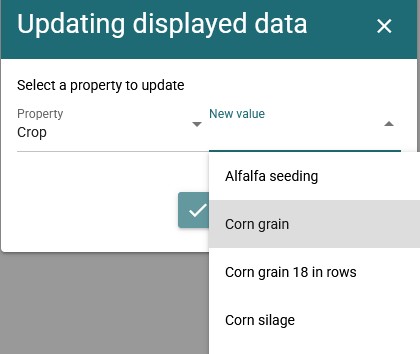
Depending on the kind of data that is being displayed or modified, the process of bulk editing plan data can be slightly different. It begins with a popup that will display on clicking the button pictured above. The first step is to select a property to update on the displayed data:
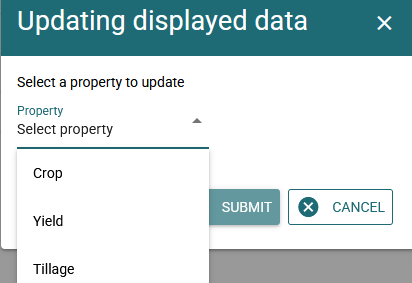
This screenshot is from the annual updates page, in the update crops tab. When a property is selected, it's time to select a value:
Note: if the data being modified is something that is picked out of a dropdown, options may be limited based on other properties of the displayed data. If no options display, adjust the filters on the displayed data until there is at least one common option for the property in all of the displayed rows.
In some cases (like selecting a crop), setting one property will reset other properties on the data. If this is the case, SnapPlus will require the user to fill these values in accordingly:
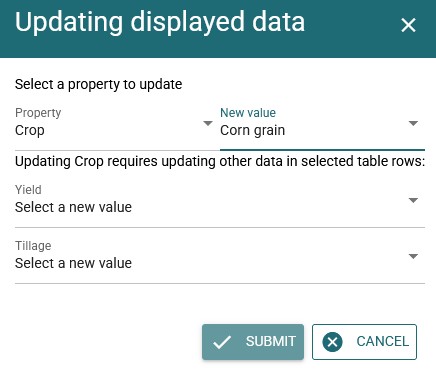
Once all necessary data is filled in, the submit button will become available.
¶ Button dropdowns
Some of the buttons in SnapPlus have little dropdown arrows in them:
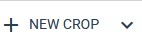
If you see a button like this, clicking the arrow will open a menu with more options.
¶ Year selector
A dropdown menu for plan years shows up in many places in SnapPlus:
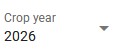
Which years are available may depend on the specific place in the application. In general, a year "exists" on a nutrient management plan if:
- There is a crop planned on that year on some field
- Some field has acres in that year
- Some field restriction applies in that year
Some parts of the application (daily log, field restrictions for example) will not allow user to select years that are in the future.
On pages that organize data by year, setting the year from this dropdown menu will change the data displayed.
¶ Dropdown menus that allow modifying options
Many parts of SnapPlus have dropdown menus that look like this:
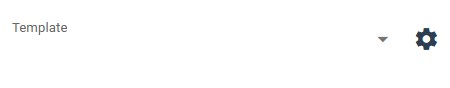
This kind of dropdown menu is able to create and modify different kinds of plan data. To see which options are available, click the gear, which will open a menu with different labels depending on where in the application it is:
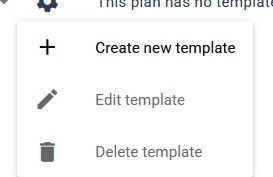
To explain the three settings in kind:
- Create new: this will turn the dropdown menu into an input box. In some cases, entering the name and waiting a second will be enough to save the data and move on to the next steps, but look out for an additional click that may be required to confirm the creation of new data.
- Edit: This will also turn the dropdown menu into an input box. You can use that input box to change the name of whatever object you are working with (a template, nutrient system, field group etc.). You will have to click to save any changes made to the name.
- Delete: It deletes.